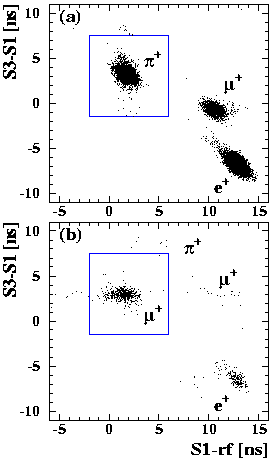


The two-dimensional TOF-distributions for events which have passed the trigger condition are shown in Fig.3. The horizontal axis is equivalent to the TOF of particles from the production target to the counter S1 relative to the accelerator 50 MHz time structure. The vertical axis is the relative TOF between the counters S1 and S3. The upper plot (a) shows the timing separation for beam particles when the entire beam-line is set to 150 MeV/c, showing clearly a separation for all particle types. The lower plot (b) shows the situation for the central momentum of an X-particle scan, where the pion part of the beam-line is set to 150 MeV/c and the muon spectrometer part is set to the momentum expected for muons associated with an X-particle i.e. 113.5 MeV/c. Since the muons from this decay should have approximately the same velocity as that of the original pions, the candidate muon events from the hypothetical decay (1) are expected to be located in plot (b) at the same location as the pions in plot (a). The timing cuts used for candidate event selection are shown by the boxes in the plot. It should be noted that the normalization of the number of events in each plot differs by four orders-of-magnitude, in (a) one has a rate of 107 particles s-1 whereas in (b) the rate is 10 particles s-1.

Figure 3: [2-D] TOF-distributions, the upper plot (a) shows the situation when the whole beam-line is set to accept pions of 150 MeV/c. Plot (b) shows the situation for the central momentum of an X-particle scan (113.5 MeV/c). See above text for full explanation.
In order to produce the final momentum spectrum of X-candidate muons, the events within the timing cuts per momentum setting are summed and normalized to the appropriate number of events in the normalization counter.
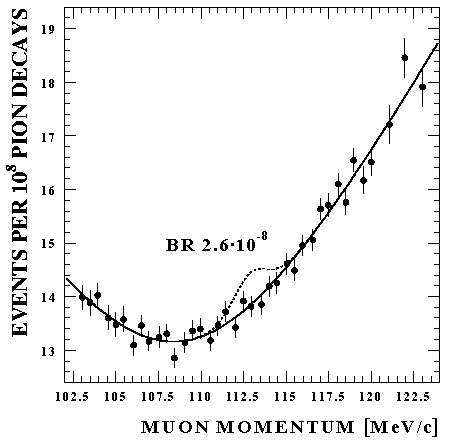
The resultant summed X-candidate muon momentum spectrum is shown in Fig.4. No peak is visible around the expected momentum for muons from decay (1). The solid curve is a hyperbolic fit to what are considered to be residual background events due to scattered muons from normal pion decays (2). The dotted curve shows the expected signal for muons from the hypothetical decay at the level of our previously obtained upper limit [7].

Figure 4: The solid curve is a hyperbolic fit to the data; the c2 is 33.1 for 33 degrees of freedom. The dashed curve shows a peak from the decay (1) with the previous upper limit on the branching fraction of h < 2.6·10-8 [7].
In order to obtain a branching fraction h defined as
h = (-0.31 ± 0.64) · 10 -8. (4)
Finally for an upper limit on the branching fraction, we used the Bayesian
approach in which the probability function for
h is set to zero for unphysical values of
h
(h < 0)
and the value of h
is found below which 95% of the physical region is contained.
Our final value for the upper limit is then:
h < 2.7 · 10 -10 (95% c.l.). (5)


