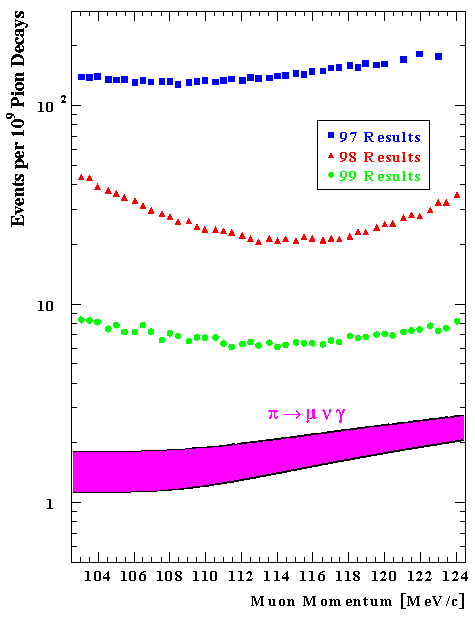
Figure 4: Samples of the results from the 1997, 1998, and 1999 measurements are plotted on a semi-logarithmic scale. Additionally, a simulation of the background expected from the radiative pion decay mode, p+ ® m+ nm g, is shown. The horizontal axis indicates the central momentum accepted by the spectrometer.