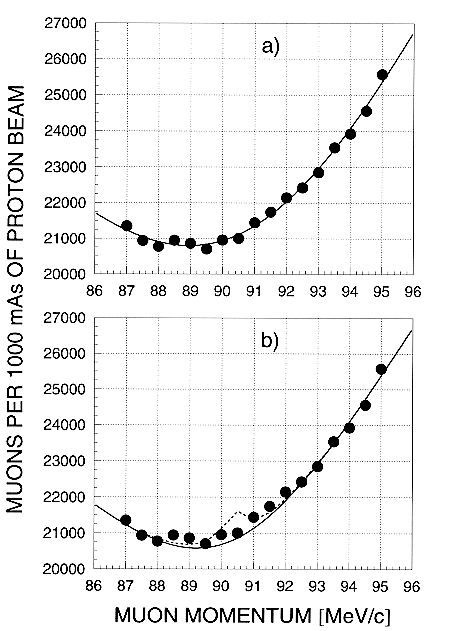

Figure 1:
Muon events in one of the detectors.
The uncertainties are about equal to the size of the dots.
a) The curve is a hyperbola fitted to the points from
momenta 87.0 to 95.0 MeV/c; the chi² is 10.0 for 12 degrees of
freedom.
b) Here the dashed curve is a fit of a hyperbola plus a peak from
the hypothetical decay pi+ ->
µ+ + X
with a branching
fraction of 2 · 10-7; the chi²
of the fit is 31.3 for 12 degrees
of freedom. The solid curve is the hyperbola without the additional peak.